"In Living Color: Images Explain El Nino Neutral’s Impact On Global Cros & Commodity Markets"
by Jim Roemer - Meteorologist - Commodity Trading Advisor - Principal, Best Weather Inc. & Climate Predict - Publisher, Weather Wealth Newsletter
Scott Mathews, Editor
Weekend Report - May 9-11, 2025
Source: Screenshot by Climate Predict LLC
- superimposed comments and markers by BestWeather
- insert of Pacific Walker Circulation image by NOAA
While the grain futures have been mostly in a bear market, even with a weaker dollar, commodities from gold to cocoa and coffee continue in bull trends. Canola prices have really been perking up.
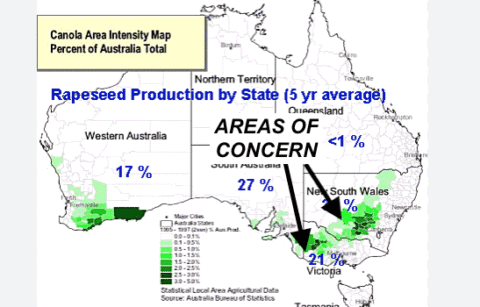
Potentially, there is a global weather problem as the drought in China is beginning to affect some crops in parts of southern Australia.
Below, I discuss how weather and the El Niño neutral stage (neither El Niño or La Niña) is affecting every commodity from wheat to ideal Midwest corn belt weather, previous crop problems in West African cocoa and why global sugar weather is improving. How about natural gas and a possible hot summer?
As a WeatherWealth newsletter subscriber, not only do you receive trading ideas, but you also see much more accurate weather information as we “second guess” standard weather models by looking at these 28 global weather teleconnections for all Ag and natural gas commodities.
—Enjoy Jim Roemer
Source: map by USDA
- commentary and indicator arrows added by BestWeather
Source: price graph by Barchart.com
- indicator arrow and superimposed wording by BestWeather
Source: screenshot by Climate Predict LLC
Source: screenshot by Climate Predict LLC with comments and indicator arrows superimposed by BestWeather
Source: map by Agri-Food Canada (a national information service)
Source: maps by stormvistawxmodels.com - used by permission
- superimposed comment and indicator arrow by BestWeather
Source: map by WeatherBELL - used by permission
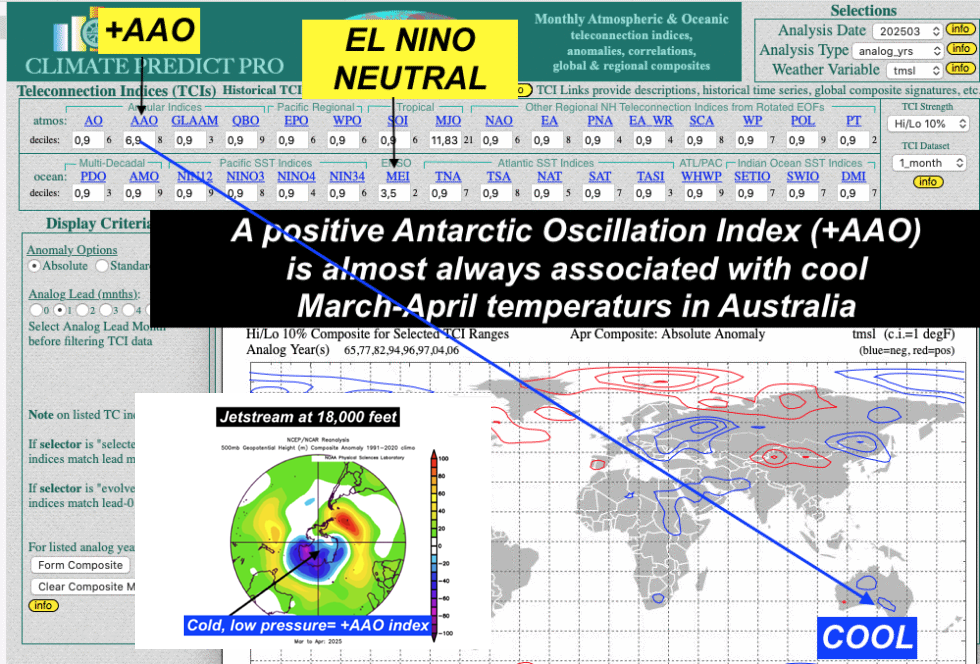
Sources: three screenshots above by Climate Predict LLC
- superimposed comments and indicator arrows by BestWeather
- antarctic polar projection map insert by NOAA, with superimposed markers by BestWeather
Source: maps by USDA, with indicator arrow superimposed by BestWeather
Source: map by WeatherBELL - used by permission
Source: maps by NOAA with superimposed labels and comments by BestWeather
Source: map by NOAA with superimposed arrow indicator by BestWeather
Sources: seasonality table by MRCI (used by permission), with superimposed elements by BestWeather
- Map by stormvistawxmodels.com - used by permission - comments and indicators by BestWeather
Source: BestWeather Spider - royalty free natural gas flair photo by pexels.com
Artwork created via AI software DALL-E 3 and is the property of BestWeather
Thanks for your interest in commodity weather!!!
Mr. Roemer owns Best Weather Inc., offering weather-related blogs for commodity traders and farmers. He also is a co-founder of Climate Predict LLC, a detailed long-range global weather forecast tool. As one of the first meteorologists to become an NFA registered Commodity Trading Advisor, he has worked with major hedge funds, Midwest farmers, and individual traders for over 35 years. With a special emphasis on interpreting market psychology, coupled with his short and long-term trend forecasting in grains, softs, and the energy markets, he commands a unique standing among advisors in the commodity risk management industry.
This article contains syndicated content. We have not reviewed, approved, or endorsed the content, and may receive compensation for placement of the content on this site. For more information please view the Barchart Disclosure Policy here.